![]() This is for all those in IT people working in crazy environments. Have you ever found your self trying to administer several systems, all using different technologies, insane IT operations that break all the time, no documentation, people who knew the systems nowhere to be found, and always trying to defend your self to the Management? Am sure you know what I am talking about, and so do I. That is why I wanted some way to get on top of things, and that was how MonitrAll was born.
This is for all those in IT people working in crazy environments. Have you ever found your self trying to administer several systems, all using different technologies, insane IT operations that break all the time, no documentation, people who knew the systems nowhere to be found, and always trying to defend your self to the Management? Am sure you know what I am talking about, and so do I. That is why I wanted some way to get on top of things, and that was how MonitrAll was born.
So when I first came to this environment and after the initial panic, I set a plan:
Step 1: Get to know my Infrastructure and operations and Document
Step 2: Gather Working Data
Step 3: Identify Issues
Step 4: Redesign and Correct Issues
Step 5: Monitor and Measure
After Step 1 I realized that the environment was insane. There was no way of managing all the information from all the systems and operations manually, so I had to somehow automate the process of gathering data and monitoring.
I remembered from my programming years that you could pretty much connect to anywhere with PHP PDO, so I started writing some code. Soon it became a full customizable system and is now an important part of my work life, saving me loads of precious hours.
What is it?
MonitraAll basically can read data, present it or run commands. The cool thing about it is that it can do that with any technology using 3 basic Channels:
- Database using PDO
- Web Services
- Execute scripts (where you can pretty much do anything you want)
The beauty of it lies in the simplicity and agility. It constantly reuses part of its self.
Features
- It can connect to basically any database that is supported by PDO, execute scripts or call web services as data sources.
- It can display data in various templates, such as boxes, tables, progress bars, todo, or even graphs.
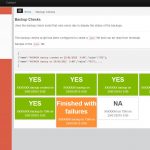
- It uses 3 simple rules for each presentation to control its behavior, and those are “what will make you go green, orange, or red“
- It can execute commands either SQL, Web service or Script, based on user input via Forms and Fields.
- It can present numerical data that can afterwards be used for statistical reasons.
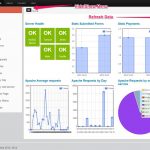
- It can display results in dashboards for easier administration of stuff.
- Every presentation is basically Web Service so it can be reused at any moment.
- It can get statistics
- It can save check’s status for reference or audit reasons
- It can send emails with results, and with preference to condition.
- All parts of the system’s access (both front and api) are controlled by a user management module capable of connecting to custom or LDAP users.
How it works
The system has a client side front application and a server side API . The front side for now is web app with only HTML\css\Javascript. No server side language is involved in the front web app. The API is a PHP application and it uses slim framework to easily create REST web services.
Here’s a brief explanation for the basic web services.
What can it be used for
Monitoring the green light on the server
Create checks to monitor your servers with the simple green, orange, red rules. For example a script that returns the ping results.
Query values from any database
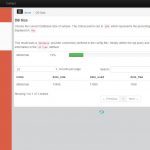
For example get values from tables in the databases that holds application status.
Administrate systems with form s
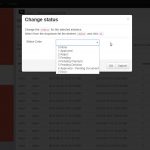
Make changes using database commands, scripts or webservices to administer stuff.
Get status of your environment with daily email
Send emails to the right people with the checks (green, orange, red) that concern them at scheduled times.
Set KPIS and monitor them
For example create a check to get the sum of sales amounts and set the green, orange, red rules accordingly. You can even use the same check to send emails when for example red is reached.
Get email notifications on critical checks
Every morning I get an email of all the critical daily checks I need to perform. Saves me a lot of time.
Statistics
Create results with numeric values and call the customStats.php daily to save these values in the statistics table.
Log Checks
Save the green, orange, red status of selected checks using the customChecks.php in the checks table.
Data quality compliance
Perform queries to get the data quality and present them as a green, orange, red check in terms of data quality compliance.
Reconsile synced database results
Perform queries to reconsile data and present them as a green, orange, red check.
Demo
There is a demo at here . It’s a bit outdated (authenitcation module and dashboards are not included) but you can get the idea. The demo actually uses a snapshot of actual data from a live environment.


